Global Innovation Index and AIS analysis
The Global Innovation Index (GII) is an annual ranking that measures the innovation performance of countries and economies worldwide. Published by the World Intellectual Property Organization (WIPO) in partnership with other organizations and institutions, the GII analyzes various aspects of innovation by considering a broad vision that includes both traditional indicators and newer dimensions, capturing the multifaceted nature of innovation.
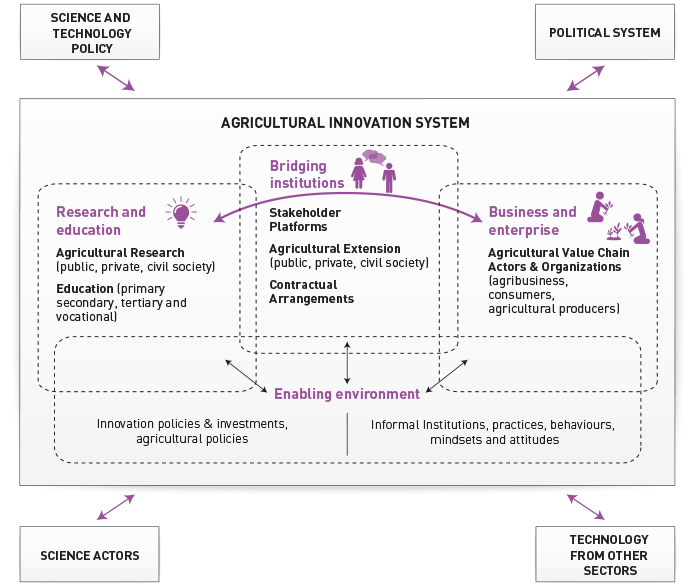
The Global Innovation Index (GII) ranking serves as a significant indicator for assessing and visualizing the impact of innovation performance on the components of the Agricultural Innovation System (AIS). Here’s how this linkage can be conceptualized and utilized:
-
Research and Education: The GII's focus on human capital, research, and development directly reflects the 'Research and Education' component of AIS. Higher GII scores in these areas indicate a country's strong educational infrastructure and research capabilities, which are critical for advancing agricultural science and training skilled agricultural professionals.
-
Bridging Institutions: The 'Institutions' pillar of the GII measures the quality of political and operational frameworks within a country, aligning with the 'Bridging Institutions' in AIS. A high GII ranking suggests effective stakeholder platforms and extension services that facilitate the transfer of innovative practices and technologies from research to farming communities.
-
Business and Enterprise: The 'Market Sophistication' and 'Business Sophistication' dimensions of the GII correlate with the 'Business and Enterprise' element of AIS. A favorable GII score implies a dynamic business environment with strong linkages between innovators, producers, and consumers in the agricultural sector, promoting the growth of agribusinesses and value chains.
-
Enabling Environment: The 'Infrastructure' and 'Ecological Sustainability' aspects of the GII are pertinent to the 'Enabling Environment' of AIS. Effective policies, as captured by the GII, foster an environment conducive to agricultural innovation, including supportive agricultural policies, investments in innovation, and a culture that values sustainable practices.
By analyzing a country’s GII ranking, stakeholders in the agricultural sector can identify which areas require more attention and resources. For instance, a low GII score in 'Human Capital and Research' suggests a need for increased investment in agricultural education and research. Conversely, a high score in 'Market and Business Sophistication' indicates a robust platform for commercializing agricultural innovations, allowing efforts to focus on enhancing other components of AIS.
To analyze the correlation between a country's GII score and its performance in each component of the AIS, we first mapped each GII indicator to a corresponding AIS component. For instance, the GII indicators “Ease of starting a business,” “Ease of resolving insolvency,” and “Ease of paying taxes” were linked to the “Enabling Environment” component of the AIS. Similarly, the GII indicators “Expenditure on education” and “School life expectancy” were associated with the “Research and Education” component.
We conducted two types of analyses: a radar clustering analysis to evaluate Innovation Readiness and a stacked bar analysis to evaluate Innovation System Balance. The clustering analysis categorizes countries into three groups based on their overall performance across various indicators. This approach helps identify patterns such as “high-performing countries,” “middle-performing countries,” and “countries needing further development” in terms of their GII scores.
The stacked bar chart analysis is particularly useful for examining the balance of strengths across different AIS components within each country. It helps pinpoint where targeted policies or investments may be most effective in fostering agricultural innovation and advancing overall development.
Innovation Readiness

The image shows three radar charts, each representing a different cluster (High Innovation Readiness, Medium Innovation Readiness, and Low Innovation Readiness) derived from a clustering analysis. Each cluster represents a group of countries. The countries belonging to each cluster can be viewed here. Radar charts are an effective way to display multivariate data in a two-dimensional format, where each variable is represented on a separate axis originating from the same central point.
High Innovation Readiness (Cluster 2): The radar chart for this cluster indicates higher values in the "Business and Enterprise" and "Enabling Environment" categories, suggesting that countries in this group excel in these aspects of the Agricultural Innovation Systems (AIS). Performance in "Research and Education" and "Bridging Institutions" appears moderate, reflecting a relatively balanced innovation environment with a focus on business and regulatory dimensions. Countries in this cluster, such as Argentina, Brazil, and Chile, demonstrate strong overall performance in AIS, particularly in fostering dynamic business ecosystems and enabling environments.
Medium Innovation Readiness (Cluster 0): Similar to the High Innovation Readiness cluster, this group shows higher values in "Business and Enterprise" and "Enabling Environment," albeit slightly lower than the top-performing cluster. Moderate values in "Research and Education" and "Bridging Institutions" indicate a balanced innovation profile with opportunities for further development in these areas. Countries like Ecuador, Guatemala, and Honduras belong to this cluster, demonstrating good performance in AIS while having potential for growth in research, education, and institutional frameworks.
Low Innovation Readiness (Cluster 1): The radar chart for this cluster displays a compact shape with low values across all categories. This suggests that countries in this group perform below average in all AIS components compared to the other clusters. The uniformly low values point to significant room for improvement in all dimensions of innovation. Countries such as Antigua and Barbuda, Barbados, and Haiti are included in this cluster, highlighting the challenges faced by underdeveloped innovation systems.
The radar charts provide a comprehensive view of the innovation readiness of countries in each cluster. High Innovation Readiness countries stand out for their strong business environments and enabling frameworks, while Medium Innovation Readiness countries have a balanced but less pronounced performance. Low Innovation Readiness countries face challenges across all AIS dimensions, underscoring the need for targeted policies and investments to improve their innovation systems.
Innovation System Balance

This image shows a stacked bar chart representing the Innovation System Balance of various countries in the Latin America and Caribbean region across different components of the Agricultural Innovation System (AIS). Each color-coded bar illustrates the relative contributions of the four AIS components: Bridging Institutions (Red), Business and Enterprise (Green), Enabling Environment (Blue), and Research and Education (Cyan).
Bridging Institutions (Red): This component generally has the smallest bars across most countries, suggesting that the development of bridging institutions, such as legal frameworks, cooperative mechanisms, and other supportive structures for innovation, is relatively low. This indicates a need for greater investment and development in this area.
Business and Enterprise (Green): Most countries exhibit moderate to high scores in this component, as indicated by the green bars. This suggests that the business and enterprise aspects of the AIS, which may include entrepreneurial activities, private sector engagement, and market development, are relatively stronger or more developed compared to bridging institutions.
Enabling Environment (Blue): The blue bars, often the longest in the chart, represent the enabling environment. This indicates that the conditions and policies facilitating agricultural innovation, such as infrastructure, regulatory quality, and government services, are generally well-established in many of these countries.
Research and Education (Cyan): The cyan bars show considerable variation among countries. While some countries demonstrate high scores, reflecting strong research institutions and educational programs supporting agricultural innovation, others exhibit lower scores, highlighting room for improvement in this area.
The bar chart provides a comparative overview of countries' Innovation System Balance in the AIS components. For example, Uruguay, Trinidad and Tobago, and Suriname exhibit high scores across most components, indicating robust agricultural innovation systems. In contrast, countries such as Antigua and Barbuda, Argentina, and Barbados show lower scores in several components. This disparity suggests areas where these countries might concentrate their efforts to strengthen their agricultural innovation systems.